Glenn Engstrand
From its humble origins in the 1950s, Artificial Intelligence (or AI) has grown in scope and impact; capturing the imaginations of many from Hollywood to Wall Street. We already know how AI can help us park our cars or order online but is there any way that it can help software engineers improve the quality of their services? Follow me here as I explore how I used one sub genre of AI, Machine Learning, to analyze the performance data of a microservice and diagnose two issues from that analysis.
The term “Machine Learning” (or ML) has become quite common in IT oriented media. Currently, the most popular use cases for ML are fraud detection and recommendation engines. The type of ML that we are focusing on here is what is known as classification and regression. Here is what happens in a typical classification or regression process. Event data is organized and collected into a dataset, each data point of which is a vector whose dimensions describe features and outcomes. Outcomes are dependent on features but features should not be dependent on each other. Use classification when the outcome is discrete and regression when the outcome is continuous. A model is then fitted from the dataset where some method of induction is used to capture the nature of that dependency. Through a method of deduction, the model is then tasked to predict future outcomes based on the features of current events.
How does the ML process described here pertain to analyzing microservice performance data? For our purposes, the event is a call made to an API endpoint of the microservice. Each event includes what time that the call was made, to which endpoint, was it successful, and how long that call took to complete. The microservice under analysis here is a rudimentary news feed. There are six different implementations of the same, feature identical feed. The data came from two hour load test runs of all six implementations on both Amazon’s and Google’s managed Kubernetes platform. What is under exploration here is what relationship, if any, exists between API performance (i.e. latency and throughput) and the cloud and feed implementation that was in effect at the time.
Here is the most profound difference between using ML to understand microservice performance data and the popular use cases mentioned above. We are not trying to predict future behavior. After fitting the model to the data, we want to study the model as software engineers in order to improve our understanding of how these microservices perform systematically. In this exercise, I discovered both an environmental issue in one of the cloud providers and a performance affecting bug in one of the news feed implementations after studying the models that the machine learned.
ML is actually a broad category of statistical algorithms. The specific algorithm that was used here is called a decision tree. Decision trees are a good choice for analyzing microservice performance data because the model can be easily studied and understood by humans.
ML applications have what is called a pipeline which is just the beginning to end process that starts with the collection of events and concludes with the final determination of what was learned. The first step in our pipeline is to collect the event data and to transform it into an ML compatible dataset. The next step is the training phase where induction is used to construct a model from the dataset. One of the problems with ML is what is known as overfitting where the model is fitted too specifically to the training data. Predictions from the model won’t generalize well to future events. For that reason, the dataset is actually split up into training data and testing data. After the model is fitted to the training data, it is used to see how accurately it can predict the testing data. After the testing phase, we have a measure as to the model’s generalization performance. For our purposes, the final phase in the pipeline is to inspect the model and, hopefully, gain some insight.
How did I collect the news feed performance data and convert it into an ML compatible dataset? Here is how performance is collected. A load test application sends requests to an API gateway which proxies each request to the microservice and records the performance data in Elastic Search. After the test concludes, I run a program to extract out that performance data from Elastic Search and save it as a local CSV file. That file includes the timestamp of the request, what type of request (i.e. the entity and operation), the status of the transaction, and the duration in milliseconds that it took to complete. The load test calls only three endpoints; create participant, friend two participants, and broadcast a news feed item to a participants’ friends. After all tests have been run, the collected data needs to be transformed into something more acceptable for ML. What we end up with is actually two datasets, one for throughput and the other for latency. Why two datasets instead of one? Because throughput and latency are not completely independent of each other. Considering that all tests ran on the same hardware capacity, if one microservice has higher throughput than another, then it stands to reason that to a degree it will also have lower latency. First, we filter out the few non-successful transactions. The data is then grouped by minute. We aggregate with addition for throughput and calculate the average for latency. The data is pivoted so that these three transactions end up as columns in each row (i.e. features in each data point) which represents a minute’s worth of performance data. Averaging introduces some inaccuracy. Averaging by the minute introduced from 2.64% (feed 3) to 11.5% (feed 1) inaccuracy which was deemed as acceptable. Rolling up to the second for latency introduced about the same amount of inaccuracy but resulted in much more complex models which did not reveal anything of interest.
The basic decision tree algorithm starts with a root tuple consisting of a feature and a threshold value which splits the dataset into two halves, those data points where that feature is on or below the threshold value and those data points where it is above. Decision tree tuples are always binary like that. From that root tuple, it then recursively builds a tree of tuples (not always the same feature) partitioning the dataset further until it finds partitions whose data points consist of a single outcome. Those partitions are represented by the leaf nodes in the tree. The specifics of tuple nesting are what is collectively known as the splitting criterion. Splitting all the way down to unanimous partitions makes decision trees highly complex and very susceptible to overfitting so various methods of pruning or limiting the tree depth are used in such a way where the leaf nodes may not represent unanimous partitions but partitions with statistically significant (and, hopefully meaningful) populations. This early termination of splitting is what is known as the stopping criterion. There are two main variations of decision tree algorithms which I will cover in the next blog. The most salient differences between those variations are in how they implement the splitting criterion and the stopping criterion.
How can you interpret a decision tree model in a meaningful way? Basically, you start at the root tuple and traverse the tree interpreting each tuple as an if-then-else decision branch. Here is an excerpt of a decision tree model built by the algorithm in Spark MLlib. I used the throughput dataset and built the decision tree where the cloud provider was the outcome being predicted.
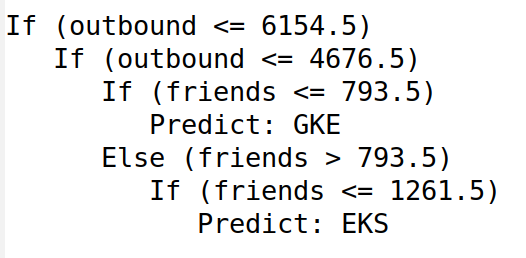
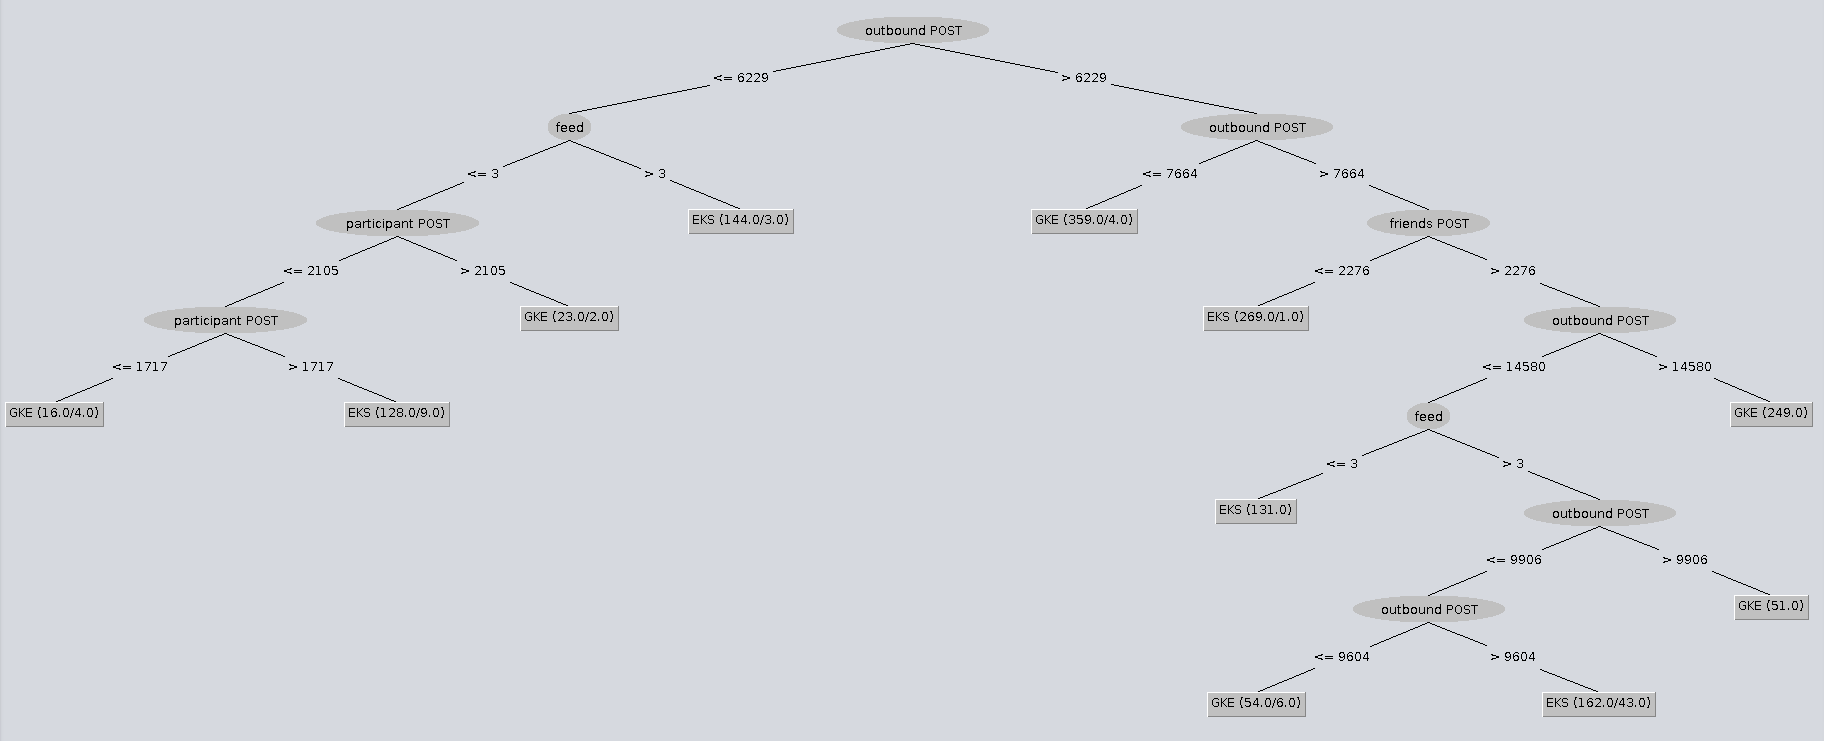
This reads as follows. If outbound throughput is under 4677 RPM and friends throughput is under 794 RPM, then the experiment ran in Google’s cloud. If outbound throughput is under 4677 RPM and friends throughput is between 794 RPM and 1261 RPM, then the experiment ran in Amazon’s cloud. That conclusion wasn’t very meaningful so let’s switch our attention to some decision tree models that helped me find meaningful insights. Both of the models, whose graphical representations are shown in this blog, were built using the Weka (Waikato Environment for Knowledge Analysis) open source project.
The first model (see above) predicts cloud vendor as the outcome based on throughput features. Go down the right hand side of the tree. Follow the decision branches where outbound throughput is higher than 7664 RPM and friends throughput is lower than 2276 RPM. Of the 270 data points that fit that criteria, 269 were run in Amazon’s cloud. That is significant and forms the basis for my conclusion about MySql throttling in Amazon as it appeared in my previous blog comparing GKE to EKS.
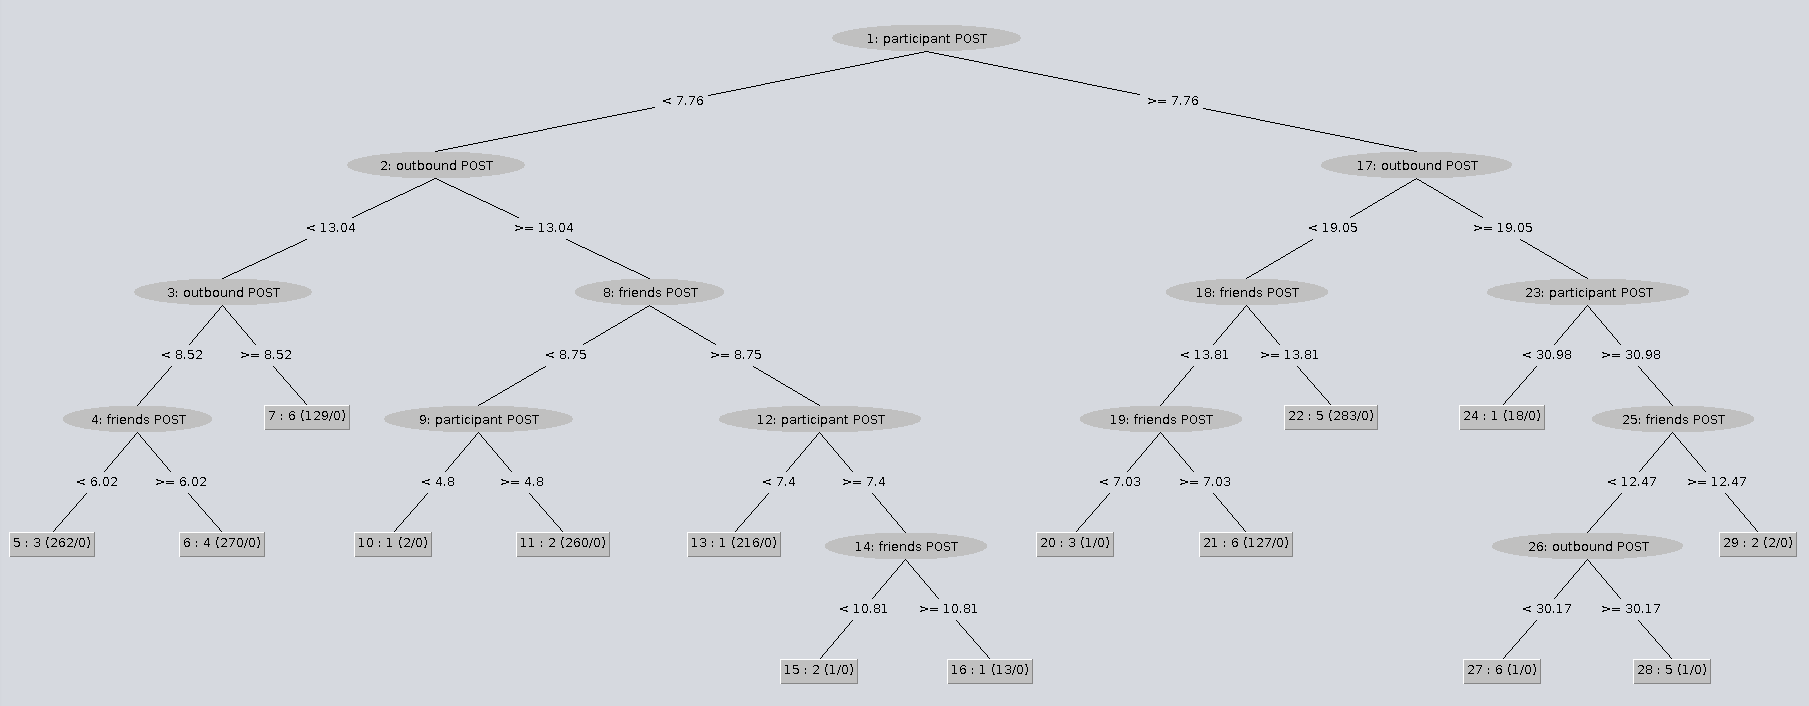
The second model predicts feed implementation as the outcome based on latency features. This time, go down the middle of the left hand side of the tree. Notice that all 260 data points where friend latency was low yet participant latency was high came from the feed 2 (Scala) version of the news feed. That seemed suspicious to me so I took a look at the save method from the Participant class in that project to see if there was any inefficiencies there. Sure enough, that method (which was originally designed to be called when either updating or creating a participant) attempts to remove the corresponding value from the cache. In the event of create participant (which is the only participant call that the load test application makes), there can be no existing value in the cache so that attempt to delete it is wasteful and unnecessary.
Is ML necessary for this kind of analysis? No. You can go on a hunting expedition by using simple graphical methods until you stumble across these outcomes. It is just that ML provides a systematic way of doing that hunting for you and much faster than what you can do manually. Is ML always the best approach to analyzing microservice performance? I believe that using ML, as described here, can help you solve what I call “move the needle” problems where there is no specific incident or outage but you just want to improve performance overall. Will using ML guarantee that you will always find actionable results? No. It is just another tool in your toolbox. There are no guarantees that you can always find ways to improve your services.
In this blog, you learned how to collect microservice performance data. I showed you how to manipulate that data in an ML compatible way and analyze it with a decision tree algorithm. We covered how to interpret the model in a way that is actionable for improving the quality of your microservices.